The Brief
Every commercial remote pilot is trained to check wind speed before flight. Manufacturer specification sheets list maximum wind resistance ratings�typically 12 m/s (27 mph or 23 knots)�which operators treat as a binary green-or-red operating ceiling. If the anemometer reads 21 knots, pilots assume the aircraft can execute the mission with normal endurance margins.
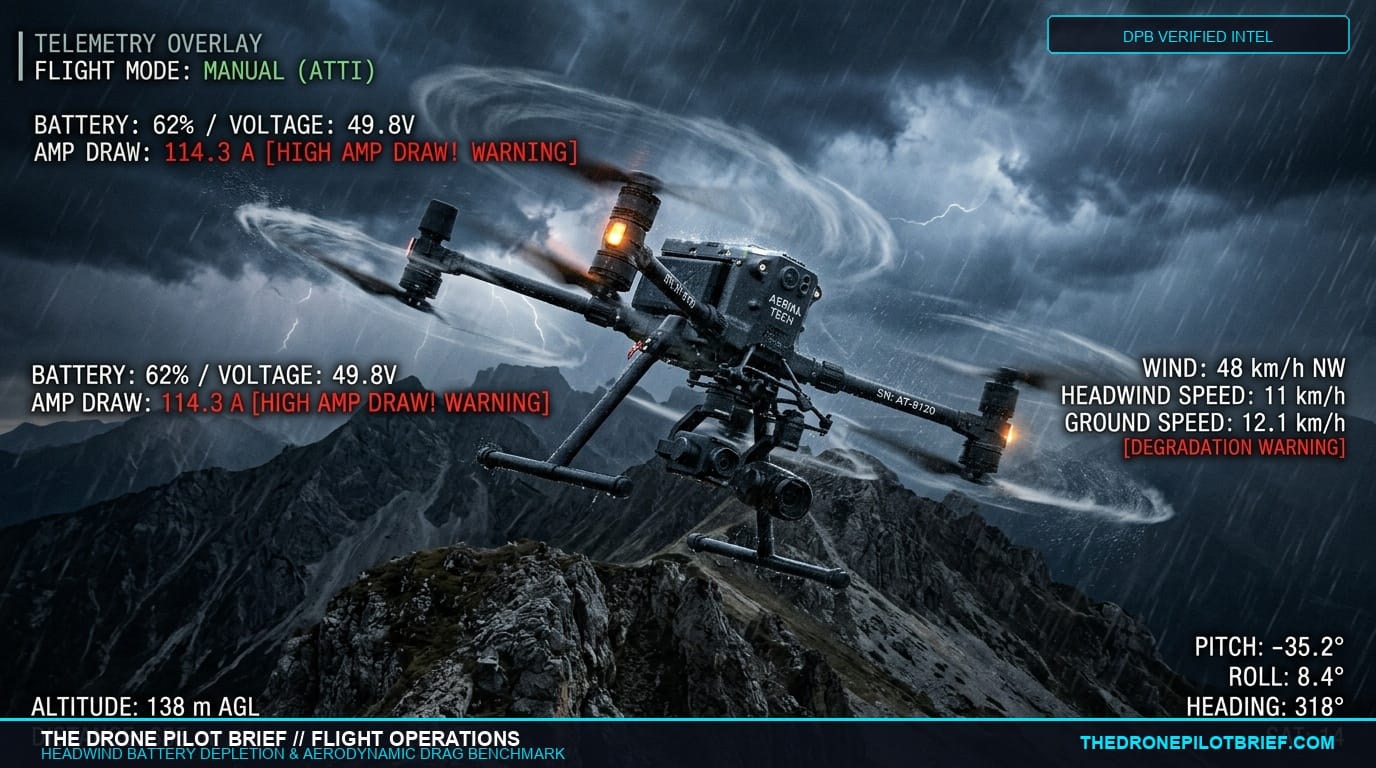
In multirotor aerodynamics, however, battery depletion during headwind penetration is fundamentally non-linear. Because aerodynamic drag scales with the square of airspeed, and power required to overcome drag scales with the cube of airspeed, increasing aircraft velocity to penetrate a gusting headwind creates an exponential spike in LiPo/Li-ion current draw (amperes).
This operational benchmark models the physical dynamics of ground speed versus airspeed, calculates the steepening voltage sag curve under sustained high-pitch transit, and establishes the mathematical Point of No Return (PNR). Understanding this curve is the single most critical factor in preventing downwind flyaways and unrecoverable low-battery ditchings.
You send your drone 1.8 miles downwind along a river corridor to inspect an electrical transmission tower.
With a 20-knot tailwind pushing the aircraft, outbound transit is effortless. The drone glides at 42 mph while sipping a modest 18 amps of battery current. You reach the tower in less than three minutes, using only 12% of your battery pack.
Satisfied, you trigger Return-to-Home (RTH).
The aircraft turns into the wind, pitches forward at an aggressive 32-degree angle, and screams at full motor RPM. But looking at your ground speed telemetry, the drone is crawling forward at just 6 miles per hour. On the battery monitor, the current draw hasn�t doubled�it has quadrupled to 74 amps. The voltage sags instantly below 3.4 volts per cell.
Before the aircraft covers half the return distance, the flight controller triggers an automatic critical low-voltage forced landing into the trees.
You did not suffer a hardware failure. You were trapped by the cubic power law of atmospheric aerodynamics.
The Aerodynamic Power Equation
Parasitic drag power required by a multirotor scales with the cube of airspeed: (P_{drag} = rac{1}{2} ho v^3 C_d A). When airspeed doubles from 10 m/s to 20 m/s to fight a headwind, the power demanded from the battery pack increases by an astonishing 800% (8×).
1. Airspeed vs. Ground Speed: The Deceptive Vector
In crewed aviation, pilots operate strictly by airspeed indicators. In commercial drone cockpits, however, ground control stations display ground speed derived from GNSS.
This creates a dangerous cognitive illusion:
- Outbound with 10 m/s Tailwind: To achieve 15 m/s ground speed, the drone only needs an airspeed of 5 m/s. Motor load is minimal; endurance is maximized.
- Inbound against 10 m/s Headwind: To achieve that same 15 m/s ground speed, the aircraft must maintain an airspeed of 25 m/s (56 mph). If the aircraft's maximum physical airspeed in GPS mode is capped at 18 m/s, its net forward ground speed drops to a glacial 8 m/s while the motors run at 100% duty cycle.
2. The Voltage Sag Cascade
Commercial drone flight controllers calculate remaining battery percentage based on a hybrid of coulomb counting and rest-voltage lookup tables.
When high aerodynamic drag forces continuous 70A to 110A discharge rates, internal cell resistance causes severe voltage sag. A battery reading 45% remaining capacity can collapse below critical cutoff voltage in seconds, causing the smart battery management system (BMS) to override pilot stick inputs and initiate an immediate auto-descent, regardless of what obstacles lie below.
Flight-Ready Breakdown
1. What Changed
Larger enterprise payloads (LiDAR, optical zoom, RTK modules) increase multirotor frontal drag area, drastically magnifying the non-linear battery penalty when fighting gusting headwinds during return-to-home phases.
2. Who is Affected
Commercial Part 107 pilots conducting long-range corridor mapping, linear utility inspections, search and rescue reconnaissance, and coastal/ridge infrastructure surveys.
3. Why it Matters
Hull loss and flyaway risk. Headwind battery exhaustion is one of the leading causes of unrecoverable drone ditchings in commercial aviation.
4. Before Next Mission
- Always Fly Outbound into the Wind: Plan your mission profile so the outbound leg is flown directly into the headwind. This ensures the return leg enjoys a tailwind buffer when battery reserves are depleted.
- Lower Altitude on the Return Leg: Surface friction naturally slows wind velocity near the ground. Dropping from 350 feet to 100 feet AGL during a headwind return often cuts wind speed by 30% to 50%, doubling your forward ground speed.
- Enforce the 50% Battery Rule in Wind: When wind speeds exceed 15 knots, set your RTH threshold to 50% remaining capacity rather than the standard 25%.
5. What Not to Assume
- Do not assume remaining battery percentage indicates remaining flight time: A 50% battery under an 80A headwind discharge rate will deplete up to three times faster than that same 50% during a hover.
- Do not assume automatic RTH uses optimal airspeed: Factory RTH speeds are fixed defaults that rarely optimize aerodynamic efficiency against gusting headwinds; manual throttle management frequently recovers ground speed faster.
Primary Sources & References

Related Briefs
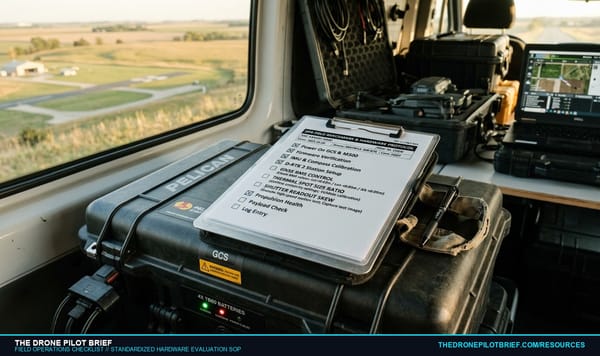
The DPB Field Benchmark SOP: Pre-Flight Geodetic & Sensor Verification Checklist
Never fly an unverified payload. Here is the standardized 10-point field checklist used by the DPB Field Lab to verify GNSS RTK integer fixes, radiometric thermal calibration, and shutter readout skew....

Standard Cockpit Callouts: Crew Resource Management for Two-Person Remote Pilot Teams
Crew miscommunication is the silent driver of enterprise drone accidents. Here is the standardized verbal callout protocol between Remote Pilot in Command (RPIC) and Visual Observer (VO) that prevents airspace conflicts and collision hazards....

Why FPV training starts in a simulator — and cannot end there
A simulator is a cheap place to fail at an unfamiliar stick. It is not proof you can fly the aircraft you will take to a job. Treat simulation as a gate for basic control, then prove the same maneuvers on the real airframe....
Get The Preflight
The weekly operational-intelligence briefing for drone pilots. Filtered down to what actually matters before your next mission.